Introduction
A large part of being a system administrator is collecting accurate information about your servers and infrastructure.There are a number of tools and options for gathering and processing this type of information such as Cacti.
Cacti is an open source web based network monitoring tool front-end for the data logging tool called RRDtool. It’s allow users to check the services at an interval of time and resulting in the graph format.
For more information, you can visit the website of Cacti, and check our article in this link .
Purpose and Target Audience
This article describes how to monitor Linux servers with Cacti using SNMP.
SNMP stands for simple network management protocol. It is a way that servers can share information about their current state, and also a channel through which an administer can modify pre-defined values. While the protocol itself is very simple, the structure of programs that implement SNMP can be very complex.
This article is intended for use by Cacti Administrators who want to monitor Linux machines with Cacti.
If you haven’t installed Cacti yet, check the following article.
On Ubuntu based systems:
This tutorial explains the process to monitor your linux servers with Cacti and SNMP.
In this article we will show you how to install and configure SNMP in the remote server and how to add the host to Cacti.
Install and Configure SNMP on Ubuntu 14.04/14.10
We can begin to explore how SNMP can be implemented on a system by installing the SNMP agent on some Ubuntu systems.
1- Install SNMPd agent on Ubuntu Server
Type the following command as root, enter:
apt-get update && apt-get install snmpd
2- SNMPd Configuration
The snmpd daemon must be configured to work with Cacti. The configuration file is located at “/etc/snmp/snmpd.conf“. Make sure you are editing the snmpd.conf file and not the snmp.conf file.
To get started, on our agent computer, we need to open the daemon’s configuration file with sudo privileges:
sudo nano /etc/snmp/snmpd.conf
First, we need to change the
directive. Currently, it is set to only allow connections originating from the local computer. We need to comment out the current line, and uncomment the line underneath, which allows all connections
#  Listen for connections from the local system only

<span class="highlight">#</span>agentAddress  udp:127.0.0.1:161

#  Listen for connections on all interfaces (both IPv4 *and* IPv6)

<span class="highlight">agentAddress udp:161,udp6:[::1]:161</span>
Add view
<span class="title">view</span> all included .<span class="number">1</span> <span class="number">80</span>
ACCESS CONTROL
Change the following line:
rocommunity <span class="keyword">public</span> <span class="keyword">default</span> -V systemonly
To:
rocommunity test1252serc <span class="keyword">default</span> -V <span class="built_in">all</span>
The snmp community is test1252serc.
SYSTEM INFORMATION
You can add the physical location of your server and a contact email. These may be helpful for distinguishing machines if you are monitoring a large number of cloud servers.
<span class="title">sysLocation</span>    Your System Location

sysContact     contact<span class="variable">@email</span>.com
After you are done with your modifications, save the file, exit and restart the snmpd service.
$su<span class="operator"><span class="keyword">do</span> service snmpd restart</span>
Install and Configure SNMP on Centos
1- Install SNMP and SNMP Utilities
Installing SNMP and some optional SNMP utilities is as simple as running one command:
yum -y install net-snmp net-snmp-utils
2- Add a Basic Configuration for SNMP
Now, let’s take the default SNMP configuration file, /etc/snmp/snmpd.conf and move it to an alternate location,/etc/snmp/snmpd.conf.orig.
mv /etc/snmp/snmpd.conf /etc/snmp/snmpd.conf.orig
And now we’ll create a new /etc/snmp/snmpd.conf:
vim /etc/snmp/snmpd.conf
# Map 'tes90w90t' community to the 'AllUser'

#       sec.name        source          community

com2sec AllUser         default         tes90w90t


# Map 'ConfigUser' to 'ConfigGroup' for SNMP Version 2c

# Map 'AllUser' to 'AllGroup' for SNMP Version 2c

#                       sec.model       sec.name

group   AllGroup        v2c             AllUser


# Define 'SystemView', which includes everything under .1.3.6.1.2.1.1 (or .1.3.6.1.2.1.25.1)

# Define 'AllView', which includes everything under .1

#                       incl/excl       subtree

view    SystemView      included        .1.3.6.1.2.1.1

view    SystemView      included        .1.3.6.1.2.1.25.1.1

view    AllView         included        .1


# Give 'ConfigGroup' read access to objects in the view 'SystemView'

# Give 'AllGroup' read access to objects in the view 'AllView'

#                       context model   level   prefix  read            write   notify

access  AllGroup        ""      any     noauth  exact   AllView         none    none
The above text is noted with basic information on the function of each configuration line. In short, we’re creating this scenarios for the polling
AllUser is assigned to AllGroup and may only use SNMP security model 2c , AllGroup can use the AllView .
AllView is assigned to the entire OID tree, and all of this is referenced in an SNMP poll by the secret, and unique community string tes90w90t.
service snmpd restart
Configure SNMP to start when the server boots:
chkconfig snmpd on
3- Test the SNMP Configuration
If you have a firewall configured, ensure that you have UDP port 161 open to your SNMP lookup server.
On your SNMP lookup server, you can do the following to perform a quick SNMP test to ensure that it’s working.
snmpwalk -v 2c -c tes90w90wer -O e 127.0.0.1
you should get an output like below :
SNMPv2-MIB::sysDescr.0 = STRING: Linux 2.6.18-194.11.4.el5xen #1 SMP Tue Sep 21 05:40:24 EDT 201
0 x86_64
SNMPv2-MIB::sysObjectID.0 = OID: NET-SNMP-MIB::netSnmpAgentOIDs.10
DISMAN-EVENT-MIB::sysUpTimeInstance = Timeticks: (242211) 0:40:22.11
SNMPv2-MIB::sysContact.0 = STRING: root@localhost
SNMPv2-MIB::sysName.0 = STRING:
SNMPv2-MIB::sysLocation.0 = STRING: Unknown
SNMPv2-MIB::sysORLastChange.0 = Timeticks: (2) 0:00:00.02
SNMPv2-MIB::sysORID.1 = OID: SNMPv2-MIB::snmpMIB
SNMPv2-MIB::sysORID.2 = OID: TCP-MIB::tcpMIB
SNMPv2-MIB::sysORID.3 = OID: IP-MIB::ip
SNMPv2-MIB::sysORID.4 = OID: UDP-MIB::udpMIB
SNMPv2-MIB::sysORID.5 = OID: SNMP-VIEW-BASED-ACM-MIB::vacmBasicGroup
SNMPv2-MIB::sysORID.6 = OID: SNMP-FRAMEWORK-MIB::snmpFrameworkMIBCompliance
SNMPv2-MIB::sysORID.7 = OID: SNMP-MPD-MIB::snmpMPDCompliance
SNMPv2-MIB::sysORID.8 = OID: SNMP-USER-BASED-SM-MIB::usmMIBCompliance
Configuring Cacti to Monitor Linux Servers
Once that is done you will need to add the new box as a device on your Cacti web interface. I wont go into much detail with that in this post, but here’s a quick walk-through.
To add devices, we login as admin and go to console in the Cacti admin panel. We click Console > Devices.
There may already be a device named ‘localhost’. We do not need it as we will create fresh graphs. We can delete this device from the list. We add a new device by using the ‘add’ button.

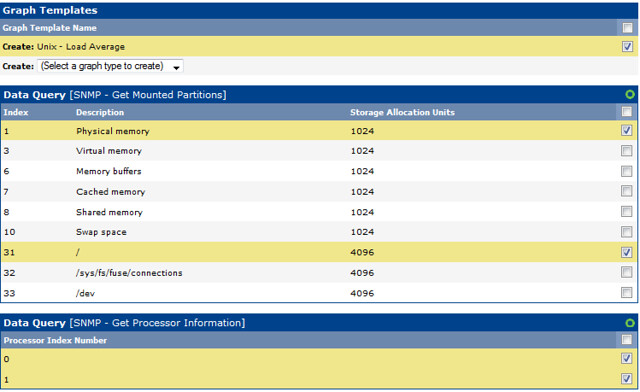
Now that the device has been added, we specify the graph templates that we want to create. This section can be found in the bottom section of the page.
And then we proceed to creating the graphs.
Here, we create graphs for load average, RAM and hard disk, processor.
Interface Graphs and 64-bit Counters
By default, Cacti uses 32-bit counters in SNMP queries. 32-bit counters are sufficient for most bandwidth graphs, but they do not work correctly for graphs greater than 100 Mbps. If it is known that the bandwidth will exceed more than 100 Mbps, it is always advisable to use 64-bit counters. Using 64-bit counters is not hard at all.
Note: It takes around 15 minutes for Cacti to populate new graphs. There are not alternatives to being patient.
Creating Graph Trees
To create a new graph tree, select the Graph Trees menu item under the Management header. Select Add on this page to create a new tree.
The following page will prompt you for a tree name, which will be used to identify the graph tree throughout Cacti.
Along with the Name, you may select one of four currently supported Sorting Types
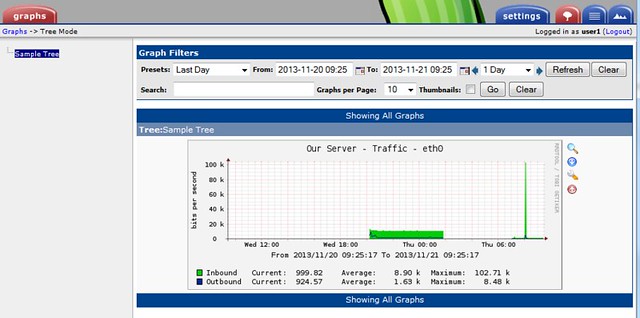
We can verify the graph in the graph tree.
User Management
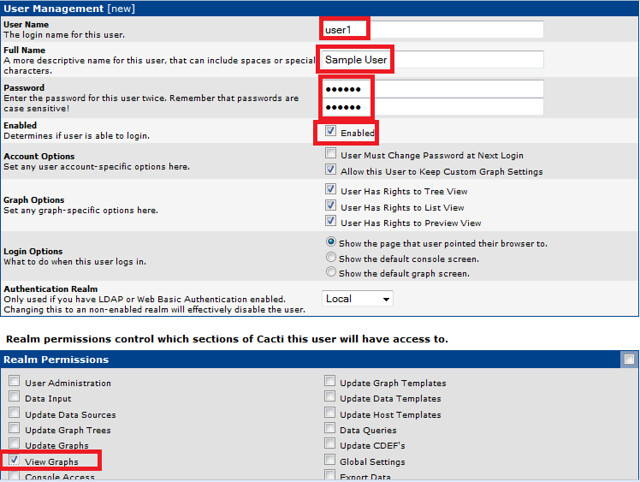
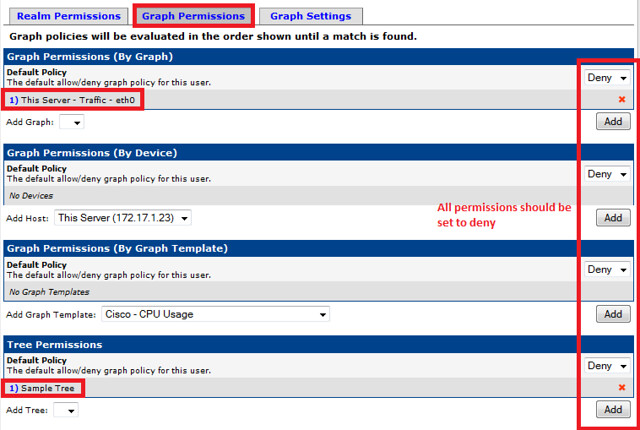
Finally, we create a user with view permission to only the graph that we have created. Cacti enables you to create users that are tailored specifically to their requirements. Each user has certain settings such as login actions, as well as graph viewing settings. There are also two levels of permissions control, realm permissions and graph permissions which enable you to control what the user can see and change.
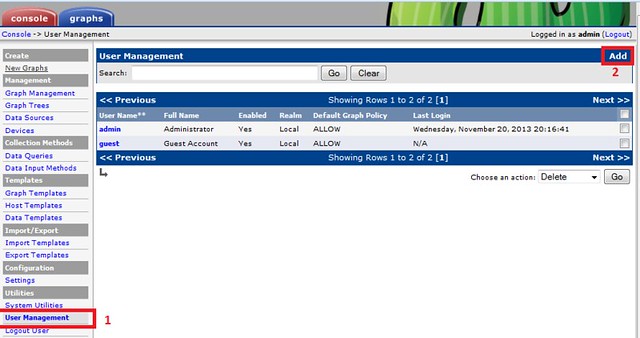
To create a new user, select the User Management item under the Utilities heading on the Cacti menu. Once at the user management screen, click Add.
At minimum, you must specify a User Name and a Password for each user.
To enable or disable a set of or a single user, select the User Management item under the Utilities heading on the Cacti menu. Once at the user management screen, select the user(s) you would like to enable or disable and select enable or disable from the Action selection box, click Go to continue.
And thus we have deployed a Cacti server in the network monitoring system. Cacti servers are stable, and can deal with tons of graphs without any problems.
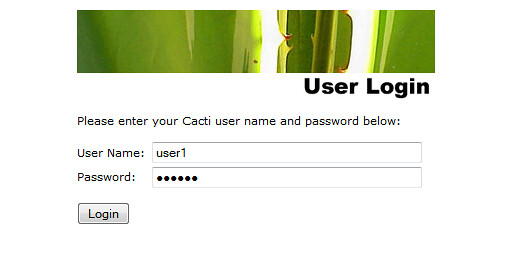
Now you have access to Cacti’s graphing capabilities.
Hope this helps and enjoy your monitoing platform!


