We have already shown you how to install and monitor network interface bandwidth usage using vnStat in our previous article. Since vnStat command is only command mode, the author of vnStat have created cool Graphical PHP frontend called vnStat PHP frontend to view vnStat graphs. You can view the network interfaces bandwidth usages in you browser itself. I must thank Unixmen Reader Padhu for mentioning this tool. Well, let us see how to install and configure vnStat PHP frontend utility.
Prerequisites
Before proceed, vnStat tool should be properly installed and should collect network statistics. To know more about installaing and Monitoring vnStat tool, refer our previous article here.
And you have to install Apache, PHP and php-gd extension. Enter the following command to install them.
On Ubuntu/Debian:
$ sudo apt-get install apache2 php5 php5-gd
On CentOS/RHEL:
$ yum install httpd php php-gd -y
Start Apache service.
On Ubuntu/Debian:
$ sudo /etc/init.d/apache2 start
On CentOS/RHEL:
$ service httpd start
$ chkconfig httpd on
Getting vnStat PHP
Download vnStat PHP tool using the following command:
$ wget http://www.sqweek.com/sqweek/files/vnstat_php_frontend-1.5.1.tar.gz
Extract it using command:
$ tar xvf vnstat_php_frontend-1.5.1.tar.gz
It will be extracted as folder vnstat_php_frontend-x.x.x in your current directory. Copy the contents of the folder to web server root folder as shown below.
On Ubuntu/Debian:
$ sudo cp -fr vnstat_php_frontend-1.5.1/ /var/www/vnstat
On CentOS/RHEL:
$ sudo cp -fr vnstat_php_frontend-1.5.1/ /var/www/html/vnstat
Configure
Open vnStat PHP config.php file.
On Ubuntu/Debian:
$ sudo vi /var/www/vnstat/config.php
On CentOS/RHEL:
$ sudo vi /var/www/html/vnstat/config.php
Set your language:
[...]
// edit these to reflect your particular situation
    //
    $locale = 'en_US.UTF-8';
    $language = 'en';
[...]
Enter you network interfaces to be monitored. In my case I am monitoring eth0 and eth1:
[...]
// list of network interfaces monitored by vnStat
    $iface_list = array('eth0', 'eth1');
[...]
Save and exit the file.
Allow apache port 80 through your firewall/router.
If you are using Ubuntu/Debian systems, run the following command:
$ sudo ufw allow 80
If you are using CentOS/RHEL:
# vi /etc/sysconfig/iptables
Add the following line.
[...]
-A INPUT -p tcp -m state --state NEW --dport 80 -j ACCEPT
[...]
Disable SELInux:
# vi /etc/sysconfig/selinux
Set SELINUX=disabled.
# This file controls the state of SELinux on the system.
# SELINUX= can take one of these three values:
#     enforcing - SELinux security policy is enforced.
#     permissive - SELinux prints warnings instead of enforcing.
#     disabled - No SELinux policy is loaded.
SELINUX=disabled
# SELINUXTYPE= can take one of these two values:
#     targeted - Targeted processes are protected,
#     mls - Multi Level Security protection.
SELINUXTYPE=targeted
Save and exit the file. Reboot your system.
Testing
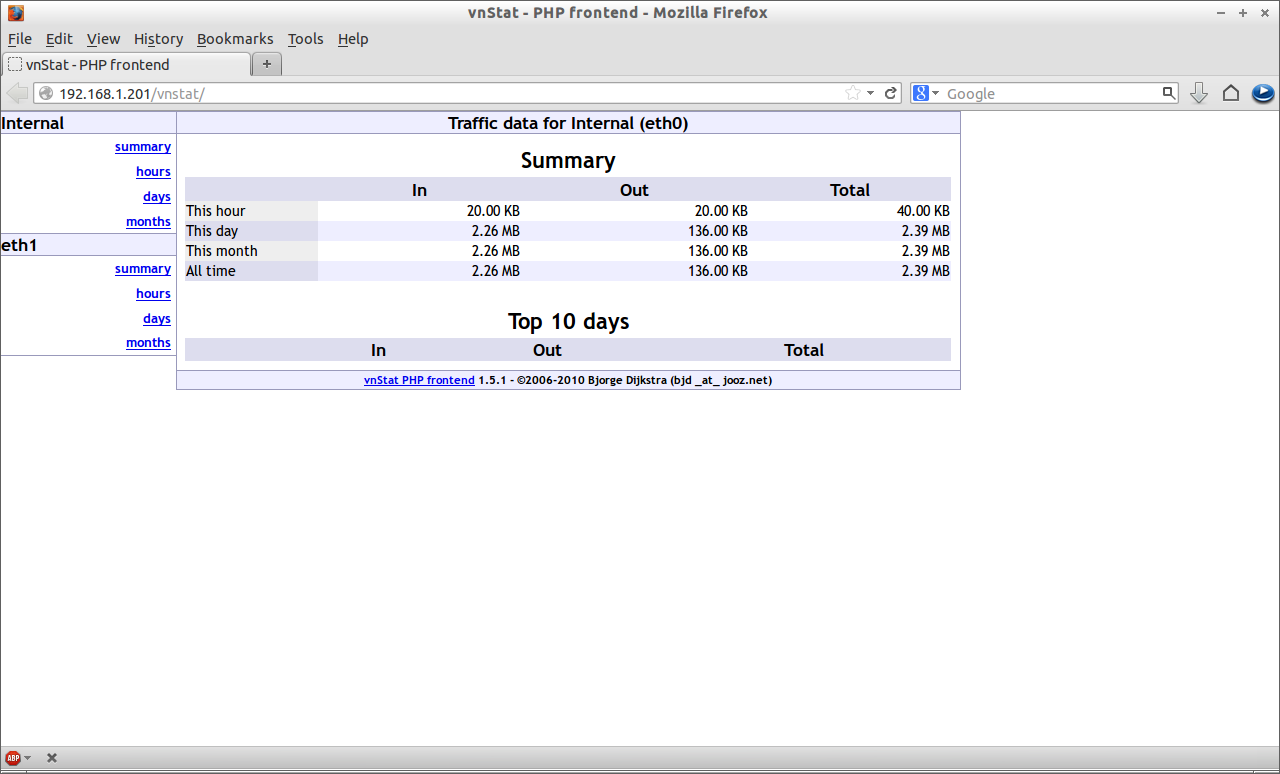
Navigate to http://localhost/vnstat or http://ip-address/vnstat from your web browser. Now you will able to see the network graphs as shown below.
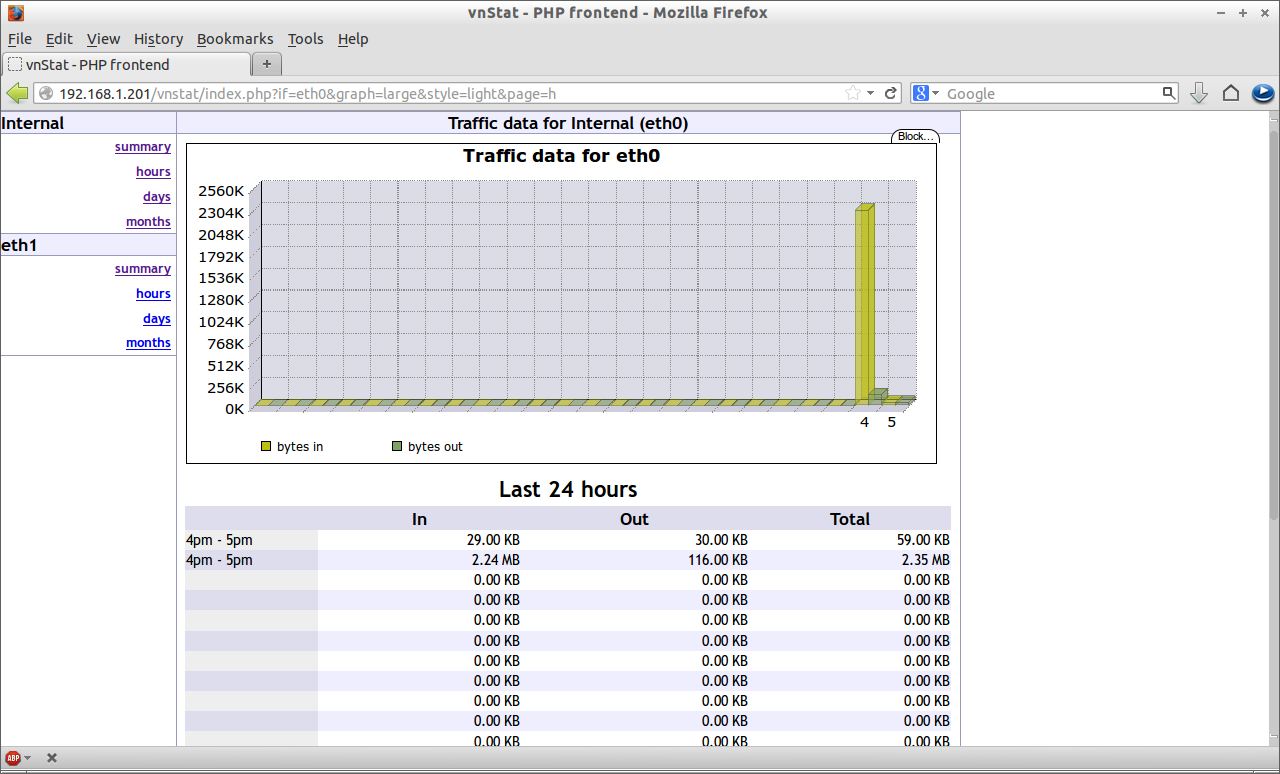
Click on the link hours in the left pane, you’ll be able to view the usage in hourly basis.
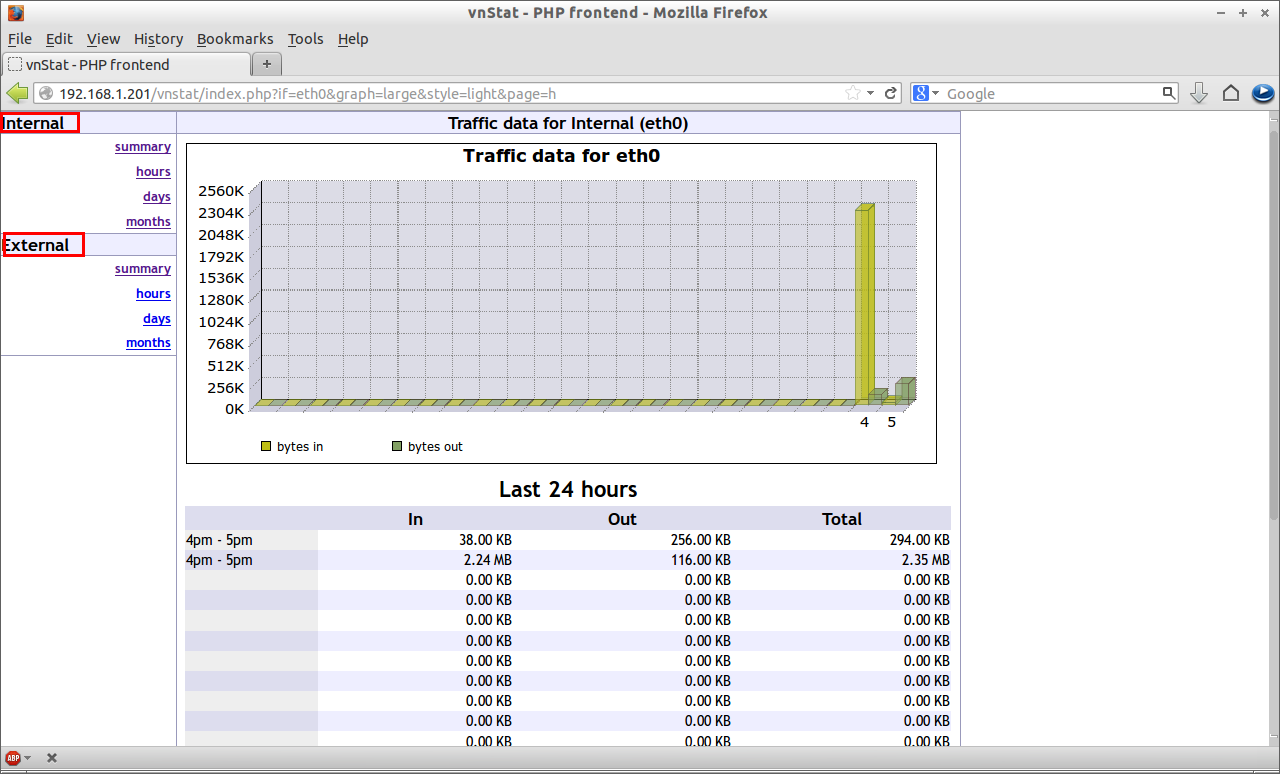
Also you can set the names for your network interfaces. To do so, open config.php file and edit as shown below.
[...]
// optional names for interfaces
    // if there's no name set for an interface then the interface identifier
    // will be displayed instead
    //
    $iface_title['eth0'] = 'Internal';
    $iface_title['eth1'] = 'External';
[...]
You can define your own names. Now refresh the page. You will see that the network interfaces names has been changed.
Thats it. Enjoy!!!


