Introduction
Whether a system is used as a web server or a normal PC, in a daily workflow, to keep under control its usage of resources is almost necessary : GNU/Linux provides several tools for monitoring purposes: iostat, vmstat, netstat, ifstat and others. Every system admin know these products, and how to analyse their outputs. However, there’s another alternative, a single program which can replace almost all of them. Its name is dstat.
With dstat, users can view all system resources instantly. For instance, someone could decide to compare the network bandwidth numbers directly with the disk throughput, having a more general view on what’s going on; this is very useful in case of troubleshooting, or to analyse a system for benchmarking.
Features
- Combines vmstat, iostat, ifstat, netstat information and more
- Shows stats in exactly the same timeframe
- Enable/order counters as they make most sense during analysis/troubleshooting
- Modular design
- Written in Python, so easy extendable
- Includes many external plugins
- Can show interrupts per device
- Very accurate timeframes, no timeshifts when system is stressed
- Shows exact units and limits conversion mistakes
- Indicate different units with different colors
- Show intermediate results when delay > 1
- Allows to export CSV output, which can be imported in Gnumeric and Excel to make graphs
Installation
To install dstat is a simple task, since it’s packaged in .deb and .rpm.
For Debian-based distro:
In RHEL, CentOS, Fedora:
Getting sta(r)ted
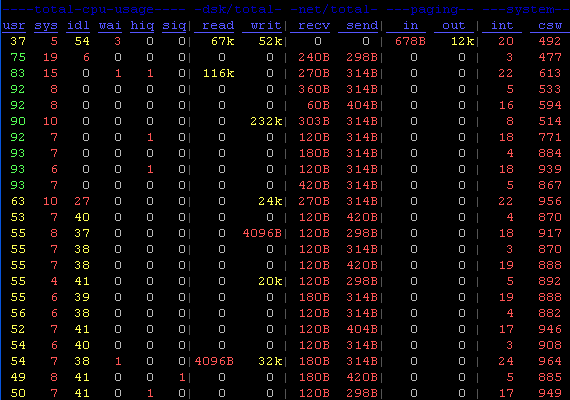
To run the program, users can just write the command in its simplest form:
as a result, it will show different infos in a table, which help admins to have a general overview.
Plugins
First of all, it’s important to note that dstat comes with a lot of plugins; for obtaining a complete list:
which returns:
Of course, it is possible to add more, for some special use case.
So, let’s see how they work.
Who wants to use some plugin must simply pass its name as a command-line argument. For instance, if someone need to verify only the total CPU usage, he can do:
or, in a shorter form
As previously said, program can show different stats at the same time. As an example:
This command, which is a combination of internal stats and external plugins, will give the total CPU usage, most expensive CPU process, disk statistics, most expensive block I/O process and the process with the highest total latency (expressed in milliseconds).
Output
By default, dstat displays output in columns (as a table, indeed) directly in terminal window, in real-time, for an immediate analysis made by a human. But there is also the possibility to send it to a .csv file, which software like Libreoffice Calc or Gnumeric can use for creating graphs, or any kind of statistical analysis. Exporting data to .csv is a quite easy task:
Conclusions
This is just a rapid overview, but this tool has a lot of potential, and can be very useful in lot of scenarios, especially for the extensibility given by its design and the choice of using Python to write it.
Users interested can look for more informations at the author’s website.


